

Evening Bitcoin Market Report: Executive Summary and Key Takeaways
Bitcoin closed the session with muted gains, trading within a tight range after mid-day volatility reversed earlier losses. Market momentum softened as spot ETF inflows stabilized, macro data failed to deliver a clear directional catalyst, and on‑chain activity showed modest upticks in exchange inflows – a signal that short-term selling pressure remains present. Key metrics observed during the session include:
- Price change: intra‑day swing of ~2-3% with close near session open;
- Volume: above 7‑day average during the reversal, suggesting participation in both moves;
- Volatility: implied vols compressed after newsflow failed to beat expectations.
These indicators point to consolidation: the market is absorbing recent gains while participants recalibrate positions ahead of potential macro prints and regulatory headlines.
For market participants,the near‑term landscape is one of selective opportunity and heightened risk management. Traders should prioritize liquidity-aware entries and watch critical technical levels-support at the short-term moving average band and resistance at recent local highs-while investors should monitor net inflows to spot durable demand shifts. Actionable watch items:
- Monitor ETF flows and custodial inflows: continued steady inflows would support a bullish structural narrative;
- Watch macro calendar: inflation and employment releases could re‑ignite directional moves;
- Set risk parameters: define stop bands and size exposures to account for episodic volatility.
Adopting a framework that balances tactical trades with strategic posture will help navigate expected episodic volatility as the market prices in evolving institutional participation and policy signals.
Price Action This Evening – Movers, Volume, and Critical Support/Resistance
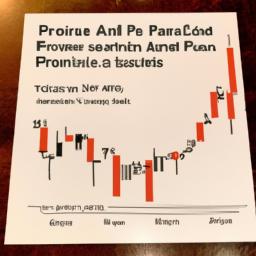
Price action this evening showed heightened intraday volatility as participants reacted to mixed signals from order flow and on‑chain activity. Trading concentrated in a relatively narrow band after an early directional attempt failed to sustain momentum, with volume spikes occurring at rejection points rather than during trend continuation. market movers included liquidity hunts around visible stop clusters and short‑covering in slow sessions; these dynamics were accompanied by sharper than average spreads on smaller venues.
- Liquidity events: rapid wick formations at local extremes,indicating stop runs.
- Volume profile: elevated on rejections, muted during attempts to establish trend.
- Participation: larger exchanges showed heavier block trades while retail volumes remained fragmented.
Technically, the market is testing several consequential levels that will dictate the next directional bias: a close above the recent swing high would invite trend continuation, while a failure to hold the consolidation floor would increase the likelihood of a deeper pullback. Traders should monitor confirmation signals – such as sustained volume on a breakout or rejection candles with compression beneath resistance – rather than relying on a single print.
- Immediate resistance: the cluster of prior highs and overhead liquidity where sellers congregate.
- Immediate support: short‑term consolidation lows and the intraday moving average acting as dynamic support.
- Watch signals: breakout with rising volume for bullish confirmation; breakdown with expanding volume and follow‑through for bearish validation.
Technical readout – Indicators, patterns, and What charts Are Signaling
Market internals and common momentum tools are signaling a cautious, data-driven view rather than a narrative. Traders should watch how moving-average crossovers interact with momentum and volume: a short-term EMA crossing above a long-term SMA suggests trend acceleration, while persistent divergence between price and a declining RSI can warn of weakening conviction. Key indicators to monitor include:
- Moving Averages - trend direction, dynamic support/resistance and crossover signals.
- MACD – momentum shifts and histogram divergence as early reversal clues.
- RSI – overbought/oversold levels and bearish/bullish divergence.
- volume/OBV - confirmation of moves; rising volume with price confirms strength, fading volume suggests exhaustion.
Chart patterns and timeframe alignment provide the context for action: intraday patterns may offer trade entries that contradict the dominant weekly trend, so confirmation across horizons matters. Classic formations-head and shoulders, double tops/bottoms, flags and triangles-gain reliability when accompanied by volume shifts and indicator agreement.Apply strict risk management and demand confirmation (volume, indicator alignment, or breakout retest) before committing capital, and always map stops to the nearest structural invalidation point to limit asymmetric downside.
Macro and On‑Chain Drivers - News, Flows, and Network Health
Recent shifts in broader crypto markets and headline news have been central to the uptick in activity. Heightened risk appetite following major market moves and fresh capital entering crypto often shows up first as increased exchange inflows and outflows, while ecosystem announcements - new dApps, cross‑chain bridges, token listings and integrations – draw developer and user attention that translates into measurable on‑chain demand. Traders and analysts watch a short list of transaction‑level flows for early signals, including:
- Stablecoin mint/redemption volumes – indicate on‑ramp/off‑ramp demand;
- Net exchange transfers – a proxy for selling pressure or accumulation;
- DEX and swap volumes – reveal speculative vs. utility usage;
- Large wallet movements – can presage coordinated trades or strategic staking.
These metrics, when read alongside news cycles and macro variables such as fiat liquidity and interest‑rate expectations, help explain whether spikes in transactions reflect durable adoption or transient speculation.
Equally significant is the protocol’s operational health, which determines whether the network can sustain higher throughput without degradation. observers focus on validator participation, block times, transaction success rates and gas price dynamics to assess resilience; consistent, low‑latency block production and minimal failed transactions point to a healthy, scalable network, while rising fees and mempool backlogs signal stress.Key on‑chain health indicators include:
- Active daily addresses vs. retained users - measures real user engagement;
- Median and tail gas prices – show congestion and fee pressure;
- Smart‑contract call composition – differentiates utility activity from bot/spam traffic;
- Validator churn and staking ratios – reflect decentralization and security.
Combining these network metrics with flow data and news context gives a clearer, more actionable picture of whether growth is enduring or driven by short‑lived momentum.
Practical Implications – Trading Strategies,Risk Management,and Short‑Term Outlook
Active traders should marry technical signals with event awareness: momentum and breakout plays can capture rapid moves,while mean‑reversion setups work when volatility contracts. Execute disciplined entries and exits, scale into positions rather than committing full size at a single price, and prefer liquid pairs and timeframes that match your strategy. Practical tactics include:
- Scaled entries: add in tranches to reduce timing risk and improve average price.
- Defined stops: set stop‑losses based on volatility (ATR) not arbitrary percentages.
- event gating: reduce or hedge exposure ahead of scheduled macro or protocol events to avoid gap risk.
Risk management must be proactive: treat bitcoin’s short‑term outlook as rangebound with intermittent breakout potential,and size positions so a single adverse move cannot derail the portfolio. Maintain clear rules for maximum per‑trade loss and total portfolio crypto exposure, and use derivatives or options to hedge when leverage is employed. For the coming days, prepare for headline‑driven spikes and quick reversals by following these rules:
- position limits: cap any single trade at a small percentage of capital (e.g.,1-2%).
- Stress scenarios: run worst‑case P&L checks for 10-20% moves to confirm survivability.
- Liquidity plan: ensure exit strategies are executable under thin market conditions.
as markets settle for the evening, today’s Evening Bitcoin market Report distilled the day’s price action, on‑chain signals and macro drivers into a clear set of takeaways you can use when assessing risk and opportunity. Keep an eye on the technical levels and volume profile that defined intraday moves, watch macro calendar items and regulatory developments that could shift sentiment, and use on‑chain metrics to read the underlying strength of market participation. Remember that volatility remains a defining feature of Bitcoin - manage position size,set clear entry and exit rules,and treat any single report as one input among many. We’ll continue to track developments and translate complex data into actionable insight; check back tomorrow for the next update and subscribe for real‑time alerts. This report is for informational purposes and not investment advice.